Phylogenetic Comparative Methods learning from trees
Chapter 1: A Macroevolutionary Research Program
Section 1.1: Introduction
Evolution is happening all around us. In many cases – lately, due to technological advances in molecular biology – scientists can now describe the evolutionary process in exquisite detail. For example, we know exactly which genes change in frequency from one generation to the next as mice and lizards evolve a white color to match the pale sands of their novel habitats (Rosenblum et al. 2010). We understand the genetics, development, and biomechanical processes that link changes in a Galapagos finches’ diet to the shape of their bill (Abzhanov et al. 2004). And, in some cases, we can watch as one species splits to become two (for example, Rolshausen et al. 2009).
Detailed studies of evolution over short time-scales have been incredibly fruitful and important for our understanding of biology. But evolutionary biologists have always wanted more than this. Evolution strikes a chord in society because it aims to tell us how we, along with all the other living things that we know about, came to be. This story stretches back some 4 billion years in time. It includes all of the drama that one could possibly want – sex, death, great blooms of life and global catastrophes. It has had “winners” and “losers,” groups that wildly diversified, others that expanded then crashed to extinction, as well as species that have hung on in basically the same form for hundreds of millions of years.
There is, perhaps, no more evocative symbol of this grand view of evolution over deep time than the tree of life (Figure 1.1; Rosindell and Harmon 2012). This branching phylogenetic tree connects all living things through a series of splitting events to a single common ancestor. Recent research has dramatically increased our knowledge of the shape and form of this tree. The tree of life is a rich treasure-trove of information, telling us how species are related to one another, which groups are exceptionally diverse or depauperate, and how life has evolved, formed new species, and spread over the globe. Our knowledge of the tree of life, still incomplete but advancing every day, promises to transform our understanding of evolution at the grandest scale (Baum and Smith 2012).
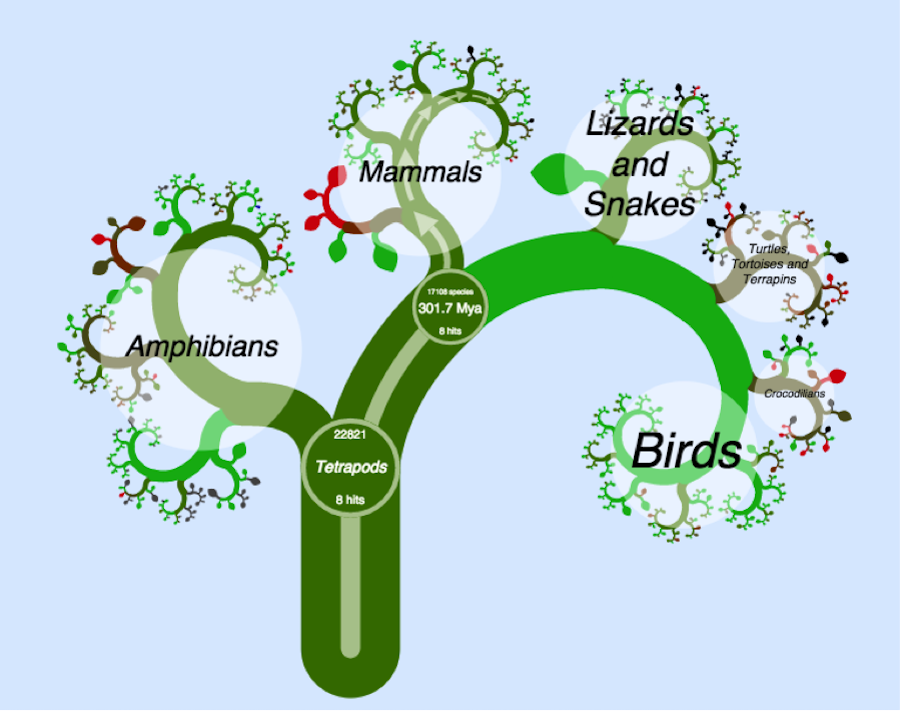
Figure 1.1. A small section of the tree of life showing the relationships among tetrapods, from OneZoom (Rosindell and Harmon 2012). This image can be reused under a CC-BY-4.0 license.
Knowing the evolutionary processes that operate over the course of a few generations, even in great detail, does not automatically give insight into why the tree of life is shaped the way that it is. At the same time, it seems reasonable to hypothesize that the same processes that we can observe now - natural selection, genetic drift, migration, sexual selection, and so on - have been occurring for the last four billion years or so along the branches of the tree. A major challenge for evolutionary biology, then, comes in connecting our knowledge of the mechanisms of evolution with broad-scale patterns seen in the tree of life. This “tree thinking” is what we will explore here.
In this book, I describe methods to connect evolutionary processes to broad-scale patterns in the tree of life. I focus mainly – but not exclusively – on phylogenetic comparative methods. Comparative methods combine biology, mathematics, and computer science to learn about a wide variety of topics in evolution using phylogenetic trees and other associated data (see Harvey and Pagel 1991 for an early review). For example, we can find out which processes must have been common, and which rare, across clades in the tree of life; whether evolution has proceeded differently in some lineages compared to others; and whether the evolutionary potential that we see playing out in real time is sufficient to explain the diversity of life on earth, or whether we might need additional processes that may come into play only very rarely or over very long timescales, like adaptive radiation or species selection.
This introductory chapter has three sections. First, I lay out the background and context for this book, highlighting the role that I hope it will play for readers. Second, I include some background material on phylogenies - both what they are, and how they are constructed. This is necessary information that leads into the methods presented in the remainder of the chapters of the book; interested readers can also read Felsenstein (Felsenstein 2004), which includes much more detail. Finally, I briefly outline the book’s remaining chapters.
Section 1.2: The roots of comparative methods
The comparative approaches in this book stem from and bring together three main fields: population and quantitative genetics, paleontology, and phylogenetics. I will provide a very brief discussion of how these three fields motivate the models and hypotheses in this book (see Pennell and Harmon 2013 for a more comprehensive review).
The fields of population and quantitative genetics include models of how gene frequencies and trait values change through time. These models lie at the core of evolutionary biology, and relate closely to a number of approaches in comparative methods. Population genetics tends to focus on allele frequencies, while quantitative genetics focuses on traits and their heritability; however, genomics has begun to blur this distinction a bit. Both population and quantitative genetics approaches have their roots in the modern synthesis, especially the work of Fisher (1930) and Wright (1984), but both have been greatly elaborated since then (Falconer et al. 1996; see Lynch and Walsh 1998; Rice 2004). Although population and quantitative genetic approaches most commonly focus on change over one or a few generations, they have been applied to macroevolution with great benefit. For example, Lande (1976) provided quantitative genetic predictions for trait evolution over many generations using Brownian motion and Ornstein-Uhlenbeck models (see Chapter 3). Lynch (1990) later showed that these models predict long-term rates of evolution that are actually too fast; that is, variation among species is too small compared to what we know about the potential of selection and drift (or, even, drift alone!) to change traits. This is, by the way, a great example of the importance of macroevolutionary research from a deep-time perspective. Given the regular observation of strong selection in natural populations, who would have guessed that long-term patterns of divergence are actually less than we would expect, even considering only genetic drift (see also Uyeda et al. 2011)?
Paleontology has, for obvious reasons, focused on macroevolutionary models as an explanation for the distribution of species and traits in the fossil record. Almost all of the key questions that I tackle in this book are also of primary interest to paleontologists - and comparative methods has an especially close relationship to paleobiology, the quantitative mathematical side of paleontology (Valentine 1996; Benton and Harper 2013). For example, a surprising number of the macroevolutionary models and concepts in use today stem from quantitative approaches to paleobiology by Raup and colleagues in the 1970s and 1980s (e.g. Raup et al. 1973; Raup 1985). Many of the models that I will use in this book – for example, birth-death models for the formation and extinction of species – were first applied to macroevolution by paleobiologists.
Finally, comparative methods has deep roots in phylogenetics. In fact, many modern phylogenetic approaches to macroevolution can be traced to Felsenstein’s (1985) paper introducing independent contrasts. This paper was unique in three main ways. First, Felsenstein’s paper was written in a remarkably clear way, and convinced scientists from a range of disciplines of the necessity and value of placing their comparative work in a phylogenetic context. Second, the method of phylogenetic independent contrasts was computationally fast and straightforward to interpret. And finally, Felsenstein’s work suggested a way to connect the previous two topics, quantitative genetics and paleobiology, using math. I discuss independent contrasts, which continue to find new applications, in great detail later in the book. Felsenstein (1985) spawned a whole industry of quantitative approaches that apply models from population and quantitative genetics, paleobiology, and ecology to data that includes a phylogenetic tree.
More than twenty-five years ago, “The Comparative Method in Evolutionary Biology,” by Harvey and Pagel (1991) synthesized the new field of comparative methods into a single coherent framework. Even reading this book nearly 25 years later one can still feel the excitement and potential unlocked by a suite of new methods that use phylogenetic trees to understand macroevolution. But in the time since Harvey and Pagel (1991), the field of comparative methods has exploded – especially in the past decade. Much of this progress was, I think, directly inspired by Harvey and Pagel’s book, which went beyond review and advocated a model-based approach for comparative biology. My wildest hope is that my book can serve a similar purpose.
My goals in writing this book, then, are three-fold. First, to provide a general introduction to the mathematical models and statistical approaches that form the core of comparative methods; second, to give just enough detail on statistical machinery to help biologists understand how to tailor comparative methods to their particular questions of interest, and to help biologists get started in developing their own new methods; and finally, to suggest some ideas for how comparative methods might progress over the next few years.
Section 1.3: A brief introduction to phylogenetic trees
It is hard work to reconstruct a phylogenetic tree. This point has been made many times (for example, see Felsenstein 2004), but bears repeating here. There are an enormous number of ways to connect a set of species by a phylogenetic tree – and the number of possible trees grows extremely quickly with the number of species. For example, there are about 5 × 1038 ways to build a phylogenetic tree1 of 30 species, which is many times larger than the number of stars in the universe. Additionally, the mathematical problem of reconstructing trees in an optimal way from species’ traits is an example of a problem that is “NP-complete,” a class of problems that include some of the most computationally difficult in the world. Building phylogenies is difficult.
The difficulty of building phylogenies is currently reflected in the challenge of reconstructing the tree of life. Some parts of the tree of life are still unresolved even with the tremendous amounts of genomic data that are now available. Accordingly, scientists have devoted a focused effort to solving this difficult problem. There are now a large number of fast and efficient computer programs aimed solely at reconstructing phylogenetic trees (e.g. MrBayes: Ronquist and Huelsenbeck 2003; BEAST: Drummond and Rambaut 2007). Consequently, the number of well-resolved phylogenetic trees available is also increasing rapidly. As we begin to fill in the gaps of the tree of life, we are developing a much clearer idea of the patterns of evolution that have happened over the past 4.5 billion years on Earth.
A core reason that phylogenetic trees are difficult to reconstruct is that they are information-rich2. A single tree contains detailed information about the patterns and timing of evolutionary branching events through a group’s history. Each branch in a tree tells us about common ancestry of a clade of species, and the start time, end time, and branch length tell us about the timing of speciation events in the past. If we combine a phylogenetic tree with some trait data – for example, mean body size for each species in a genus of mammals – then we can obtain even more information about the evolutionary history of a section of the tree of life.
The most common methods for reconstructing phylogenetic trees use data on species’ genes and/or traits. The core information about phylogenetic relatedness of species is carried in shared derived characters; that is, characters that have evolved new states that are shared among all of the species in a clade and not found in the close relatives of that clade. For example, mammals have many shared derived characters, including hair, mammary glands, and specialized inner ear bones.
Phylogenetic trees are often constructed based on genetic (or genomic) data using modern computer algorithms. Several methods can be used to build trees, like parsimony, maximum likelihood, and Bayesian analyses (see Chapter 2). These methods all have distinct assumptions and can give different results. In fact, even within a given statistical framework, different software packages (e.g. MrBayes and BEAST, mentioned above, are both Bayesian approaches) can give different results for phylogenetic analyses of the same data. The details of phylogenetic tree reconstruction are beyond the scope of this book. Interested readers can read “Inferring Phylogenies” (Felsenstein 2004), “Computational Molecular Evolution” (Yang 2006), or other sources for more information.
For many current comparative methods, we take a phylogenetic tree for a group of species as a given – that is, we assume that the tree is known without error. This assumption is almost never justified. There are many reasons why phylogenetic trees are estimated with error. For example, estimating branch lengths from a few genes is difficult, and the branch lengths that we estimate should be viewed as uncertain. As another example, trees that show the relationships among genes (gene trees) are not always the same as trees that show the relationships among species (species trees). Because of this, the best comparative methods recognize that phylogenetic trees are always estimated with some amount of uncertainty, both in terms of topology and branch lengths, and incorporate that uncertainty into the analysis. I will describe some methods to accomplish this in later chapters.
How do we make sense of the massive amounts of information contained in large phylogenetic trees? The definition of “large” can vary, but we already have trees with tens of thousands of tips, and I think we can anticipate trees with millions of tips in the very near future. These trees are too large to comfortably fit into a human brain. Current tricks for dealing with trees – like banks of computer monitors or long, taped-together printouts – are inefficient and will not work for the huge phylogenetic trees of the future. We need techniques that will allow us to take large phylogenetic trees and extract useful information from them. This information includes, but is not limited to, estimating rates of speciation, extinction, and trait evolution; testing hypotheses about the mode of evolution in a group; identifying adaptive radiations, key innovations, and other macroevolutionary explanations for diversity; and many other things.
Section 1.4: What we can (and can’t) learn about evolutionary history from living species
Traditionally, scientists have used fossils to quantify rates and patterns of evolution through long periods of time (sometimes called “macroevolution”). These approaches have been tremendously informative. We now have a detailed picture of the evolutionary dynamics of many groups, from hominids to crocodilians. In some cases, very detailed fossil records of some types of organisms – for example, marine invertebrates – have allowed quantitative tests of particular evolutionary models.
Fossils are particularly good at showing how species diversity and morphological characters change through time. For example, if one has a sequence of fossils with known times of occurrence, one can reconstruct patterns of species diversity through time. A classic example of this is Sepkoski’s (1984) reconstruction of the diversity of marine invertebrates over the past 600 million years. One can also quantify the traits of those fossils and measure how they change across various time intervals (e.g. Foote 1997). In some groups, we can make plots of changes in lineage and trait diversity simultaneously (Figure 1.2). Fossils are the only evidence we have for evolutionary lineages that have gone extinct, and they provide valuable direct evidence about evolutionary dynamics in the past.
However, fossil-based approaches face some challenges. The first is that the fossil record is incomplete. This is a well-known phenomenon, identified by Darwin himself (although many new fossils continue to be found). The fossil record is incomplete in some very particular ways that can sometimes hamper our ability to study evolutionary processes using fossils alone. One example is that fossils are rare or absent from some classical examples of adaptive radiation on islands. For example, the entire fossil record of Caribbean anoles, a well-known adaptive radiation of lizards, consists of less than ten specimens preserved in amber (Losos 2009). We similarly lack fossils for other adaptive radiations like African cichlids and Darwin’s finches. The absence of fossils in these groups limits our ability to directly study the early stages of adaptive radiation. Another limitation of the fossil record relates to species and speciation. It is very difficult to identify and classify species in the fossil record – even more difficult than it is to do so for living species. It is hard to tell species apart, and particularly difficult to pin down the exact time when new species split off from their close relatives. In fact, most studies of fossil diversity focus on higher taxonomic groups like genera, families, or orders (see, e.g., Sepkoski 1984). These studies have been immensely valuable but it can be difficult to connect these results to what we know about living species. In fact, it is species (and not genera, families, or orders) that form the basic units of almost all evolutionary studies. So, fossils have great value but also suffer from some particular limitations.
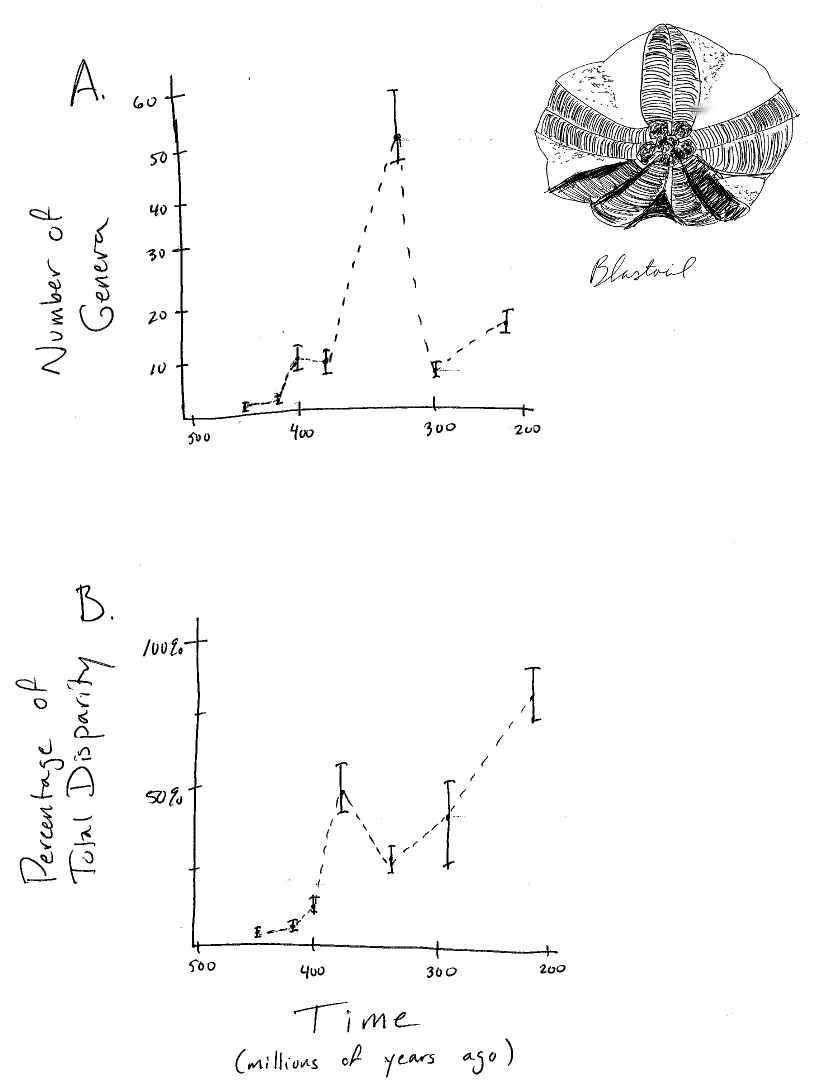
Figure 1.2. Diversity and disparity in the fossil record for the Blastoids. Plots show A. diversity (number of genera) and B. disparity (trait variance) through time. Image by the author, inspired by Foote (1997). This image can be reused under a CC-BY-4.0 license.
Phylogenetic trees represent a rich source of complementary information about the dynamics of species formation through time. Phylogenetic approaches provide a useful complement to fossils because their limitations are very different from the limitations of the fossil record. For example, one can often include all of the living species in a group when creating a phylogenetic tree. Additionally, one can use information from detailed systematic and taxonomic studies to identify species, rather than face the ambiguity inherent when using fossils. Phylogenetic trees provide a distinct source of information about evolutionary change that is complementary to approaches based on fossils. However, phylogenetic trees do not provide all of the answers. In particular, there are certain problems that comparative data alone simply cannot address. The most prominent of these, which I will return to later, are reconstructing traits of particular ancestors (ancestral state reconstruction; Losos 2011) and distinguishing between certain types of models where the tempo of evolution changes through time (Slater et al. 2012). Some authors have argued that extinction, as well, cannot be detected in the shape of a phylogenetic tree (Rabosky 2010). I will argue against this point of view in Chapter 11, but extinction still remains a tricky problem when one is limited to samples from a single time interval (the present day). Phylogenetic trees provide a rich source of information about the past, but we should be mindful of their limitations (Alroy 1999).
Perhaps the best approach would combine fossil and phylogenetic data directly. Paleontologists studying fossils and neontologists studying phylogenetic trees share a common set of mathematical models. This means that, at some point, the two fields can merge, and both types of information can be combined to study evolutionary patterns in a cohesive and integrative way. However, surprisingly little work has so far been done in this area (but see Slater et al. 2012, Heath et al. (2014)).
Section 1.5: Overview of the book
In this book, I outline statistical procedures for analyzing comparative data. Some methods – such as those for estimating patterns of speciation and extinction through time – require an ultrametric phylogenetic tree. Other approaches model trait evolution, and thus require data on the traits of species that are included in the phylogenetic tree. The methods also differ as to whether or not they require the phylogenetic tree to be complete – that is, to include every living species descended from a certain ancestor – or can accommodate a smaller sample of the living species.
The book begins with a general discussion of model-fitting approaches to statistics (Chapter 2), with a particular focus on maximum likelihood and Bayesian approaches. In Chapters 3-9, I describe models of character evolution. I discuss approaches to simulating and analyzing the evolution of these characters on a tree. Chapters 10-12 focus on models of diversification, which describe patterns of speciation and extinction through time. I describe methods that allow us to simulate and fit these models to comparative data. Chapter 13 covers combined analyses of both character evolution and lineage diversification. Finally, in Chapter 14 I discuss what we have learned so far about evolution from these approaches, and what we are likely to learn in the future.
There are a number of computer software tools that can be used to carry out the methods described here. In this book, I focus on the statistical software environment R. For each chapter, my course website, in progress, provides sample R code that can be used to carry out all described analyses. I hope that this R code will allow further development of this language for comparative analyses. However, it is possible to carry out the algorithms we describe using other computer software or programming languages (e.g. Arbor, http://www.arborworkflows.com).
Statistical comparative methods represent a promising future for evolutionary studies, especially as our knowledge of the tree of life expands. I hope that the methods described in this book can serve as a Rosetta stone that will help us read the tree of life as it is being built.
Footnotes
1: This calculation gives the number of distinct tree shapes (ignoring branch lengths) that are fully bifurcating – that is, each species has two descendants - and rooted.
2: Another difficulty is that the "tree" of life may not look much like a tree due to hybridization, introgression, and other non-branching processes. These issues are currently barely addressed by comparative methods (but see Bastide et al. 2018), and rarely in this book as well! We leave that as a pressing future problem that has only begun to be solved.
References
Abzhanov, A., M. Protas, B. R. Grant, P. R. Grant, and C. J. Tabin. 2004. Bmp4 and morphological variation of beaks in Darwin’s finches. Science 305:1462–1465.
Alroy, J. 1999. The fossil record of North American mammals: Evidence for a Paleocene evolutionary radiation. Syst. Biol. 48:107–118.
Bastide, P., C. Solís-Lemus, R. Kriebel, K. W. Sparks, and C. Ané. 2018. Phylogenetic comparative methods on phylogenetic networks with reticulations. Syst. Biol.
Baum, D. A., and S. D. Smith. 2012. Tree thinking: An introduction to phylogenetic biology. in Tree thinking: An introduction to phylogenetic biology.
Benton, M., and D. A. T. Harper. 2013. Introduction to paleobiology and the fossil record. John Wiley & Sons.
Drummond, A. J., and A. Rambaut. 2007. BEAST: Bayesian evolutionary analysis by sampling trees. BMC Evol. Biol. 7:214.
Falconer, D. S., T. F. C. Mackay, and R. Frankham. 1996. Introduction to quantitative genetics (4th edn). Trends Genet. 12:280. [Amsterdam, The Netherlands: Elsevier Science Publishers (Biomedical Division)], c1985-.
Felsenstein, J. 2004. Inferring phylogenies. Sinauer Associates, Inc., Sunderland, MA.
Felsenstein, J. 1985. Phylogenies and the comparative method. Am. Nat. 125:1–15.
Fisher, R. A. 1930. The genetical theory of natural selection: A complete variorum edition. Oxford University Press.
Foote, M. 1997. The evolution of morphological diversity. Annu. Rev. Ecol. Syst. 28:129–152.
Harvey, P. H., and M. D. Pagel. 1991. The comparative method in evolutionary biology. Oxford University Press.
Heath, T. A., J. P. Huelsenbeck, and T. Stadler. 2014. The fossilized birth–death process for coherent calibration of divergence-time estimates. Proc. Natl. Acad. Sci. U. S. A. 111:E2957–E2966. National Academy of Sciences.
Lande, R. 1976. Natural selection and random genetic drift in phenotypic evolution. Evolution 30:314–334.
Losos, J. 2009. Lizards in an evolutionary tree: Ecology and adaptive radiation of anoles. University of California Press.
Losos, J. B. 2011. Seeing the forest for the trees: The limitations of phylogenies in comparative biology. Am. Nat. 177:709–727.
Lynch, M. 1990. The rate of morphological evolution in mammals from the standpoint of the neutral expectation. Am. Nat. 136:727–741.
Lynch, M., and B. Walsh. 1998. Genetics and analysis of quantitative traits. Sinauer Sunderland, MA.
Pennell, M. W., and L. J. Harmon. 2013. An integrative view of phylogenetic comparative methods: Connections to population genetics, community ecology, and paleobiology. Ann. N. Y. Acad. Sci. 1289:90–105.
Rabosky, D. L. 2010. Extinction rates should not be estimated from molecular phylogenies. Evolution 64:1816–1824.
Raup, D. M. 1985. Mathematical models of cladogenesis. Paleobiology 11:42–52.
Raup, D. M., S. J. Gould, T. J. M. Schopf, and D. S. Simberloff. 1973. Stochastic models of phylogeny and the evolution of diversity. J. Geol. 81:525–542.
Rice, S. H. 2004. Evolutionary theory. Sinauer, Sunderland, MA.
Rolshausen, G., G. Segelbacher, K. A. Hobson, and H. M. Schaefer. 2009. Contemporary evolution of reproductive isolation and phenotypic divergence in sympatry along a migratory divide. Curr. Biol. 19:2097–2101.
Ronquist, F., and J. P. Huelsenbeck. 2003. MrBayes 3: Bayesian phylogenetic inference under mixed models. Bioinformatics 19:1572–1574.
Rosenblum, E. B., H. Römpler, T. Schöneberg, and H. E. Hoekstra. 2010. Molecular and functional basis of phenotypic convergence in white lizards at White Sands. Proc. Natl. Acad. Sci. U. S. A. 107:2113–2117.
Rosindell, J., and L. J. Harmon. 2012. OneZoom: A fractal explorer for the tree of life. PLoS Biol. 10:e1001406.
Sepkoski, J. J. 1984. A kinetic model of phanerozoic taxonomic diversity. III. Post-Paleozoic families and mass extinctions. Paleobiology 10:246–267.
Slater, G. J., L. J. Harmon, and M. E. Alfaro. 2012. Integrating fossils with molecular phylogenies improves inference of trait evolution. Evolution 66:3931–3944.
Uyeda, J. C., T. F. Hansen, S. J. Arnold, and J. Pienaar. 2011. The million-year wait for macroevolutionary bursts. Proc. Natl. Acad. Sci. U. S. A. 108:15908–15913.
Valentine, J. W. 1996. Evolutionary paleobiology. University of Chicago Press.
Wright, S. 1984. Evolution and the genetics of populations, Volume 1: Genetic and biometric foundations. University of Chicago Press.
Yang, Z. 2006. Computational molecular evolution. Oxford University Press.